The developer tools available in modern browsers are just mind blowing, and we love them here at MobileCaddy. In this post I’m going to cover a couple of tips on how I use the JavaScript console to help me build and debug my MobileCaddy apps.
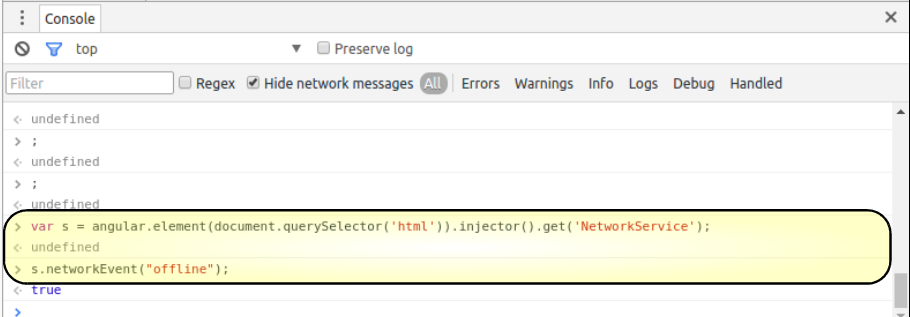
Calling Angular Services from the Console
Did you know you can call an Angular service from JS console? I didn’t.

I honestly love the fact that you can do this, but I can’t remember where I first heard about it, so sorry for not crediting a source.
Let’s say you have a service called MyService with a function myFunction(), but it’s not behaving as you thought. You can call this function with these commands in the console;
|
1 2 3 4 5 |
var s = angular.element(document.querySelector('html')).injector().get('MyService'); s.myFunction(); |
How cool is that?
Calling MobileCaddy Utils from the Console
In the same light as the above you can call the MobileCaddy API from the console too.

Let’s say you are having trouble with a smartSql call not returning what you want, or you want to make sure that you’re table contains the data you thought it did.
|
1 2 3 4 5 |
var devUtils = mobileCaddy.require('mobileCaddy/devUtils'); devUtils.readRecords("MC_Time_Expense__ap").then(function(r){console.log(r);}).catch(function(e){console.error(e);}); |
In the 2nd line I’m calling the MobileCaddy readRecords function passing in the “MC_Time_Expenses__ap” table name and, if the promise resolves I will log the output to the console, and if the call fails I will get a console error.
I have actually added the above two examples into the Sources –> Snippets in my Chrome dev tools so they’re easily accessible, and I can just copy, paste and modify them as I need to.
These two small tips have helped me no end, I hope they do the same for you too.